Monitoring history and reports
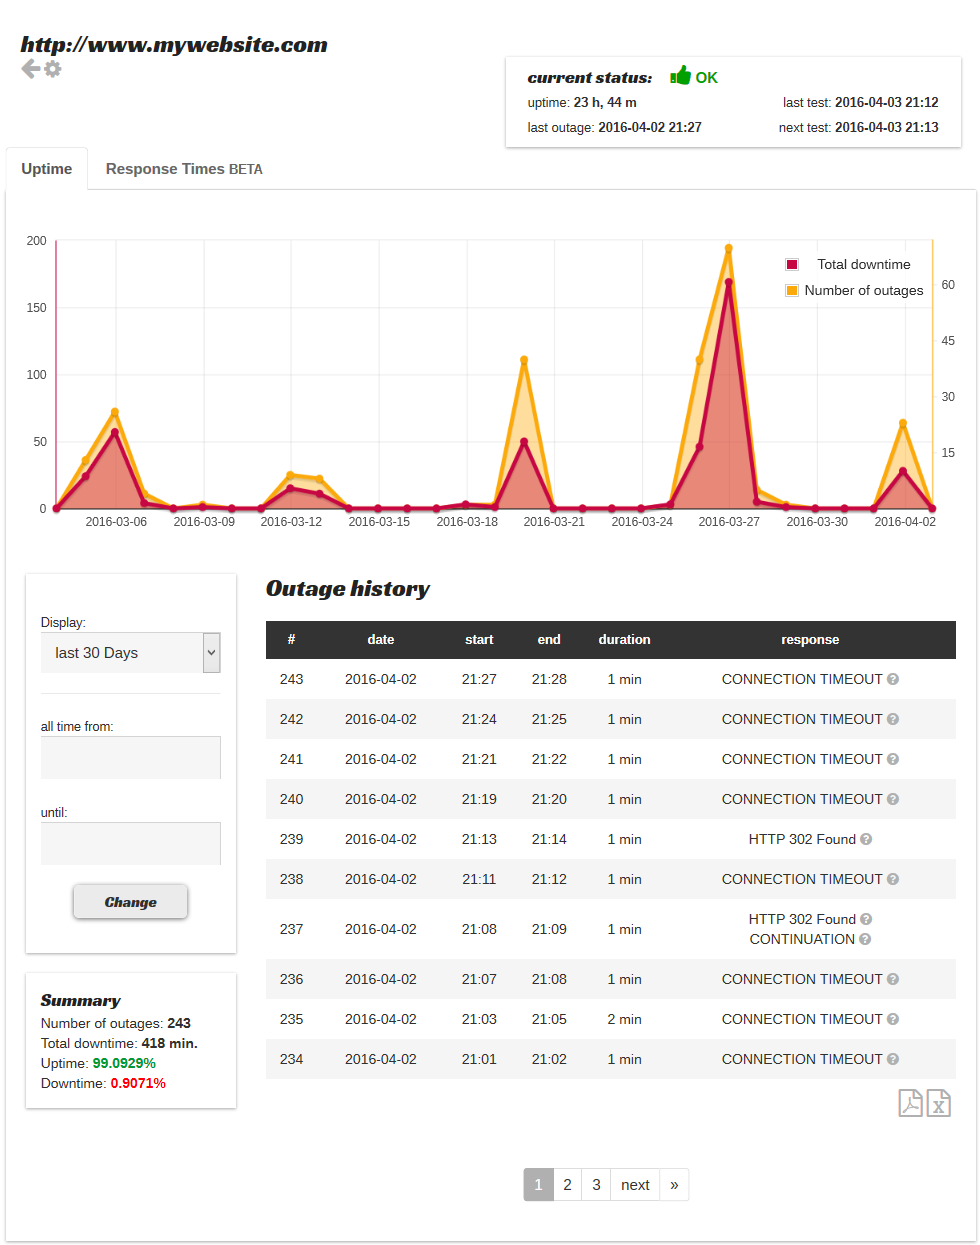
Information about all failures detected is recorded in a database (time of finding, duration, failure type) and there is unlimited access to it. In other words, the history is never deleted unless you wish to have it purged.
Tables and charts
The history of unavailability events is presented as tables (date and time of finding, duration, failure type) and charts (number of events and the total unavailability time). Time period presented in the history is by default the last 30 days but you can change this any time or even display the whole history as one chart.
Data export
One click is enough to export history data to XLS file so that they can be analyzed further.
Totals for a time period and current status
What makes it easier to have an overall look at the time period which is just being presented is the totalling module. It displays the total number of failures, total unavailability time and the uptime/downtime in percentages.
Summary reports
When you have many active tests, you can generate a summary report for all of them—or for a selected group. Such a report will include a summary—that is, the number of all failures, the total length of failure and availability (uptime) as well as unavailability (downtime) percentage. The same data will also be available for individual tests.
The generated PDF report will also contain the number of failures of each type.
For a selected list of tests, you can also group export the entire events' history in XLS format—for further analysis using external tools.
Cyclical reports
To keep abreast of what is happening, you can enable receiving cyclical reports for selected tests. Every Monday you can receive a report for the previous week, and we can send you a statement for the previous month on every first day of the month.
« back to feature list


