

Whatagraph – a Robust Reporting Solution for All Your Marketing Needs
The struggle around reporting is real – ask any data analyst or marketer. When you are involved in marketing, you will soon realize that reporting wasn’t that part you signed up for. But as some things are inevitable, you will know that these reports are crucial for your profit. As a marketer, your job is not just to brainstorm how to create unique campaigns, overcome problems, and close big deals, but it is beyond that. You will be responsible for creating reports as well, which allows you to identify campaign performance, target campaign goals, and save time and money understanding where improvements need to be made.
Now, when it comes to creating reports, experienced and intelligent marketers prefer using reporting tools. There are plenty of tools available. A reporting tool allows you to bring all the data, numbers, graphs, and a lot more together in one single place. One such tool is Whatagraph. You may have come across this platform as it is quite popular and used by many digital marketers for creating all-inclusive, visually appealing, and easy to understand reports.
This is a review guide where we will be explaining everything you need to know about Whatagraph.com, from it is to how it works, what are its features, benefits, and a lot more.
Let’s get started.
What is Whatagraph?
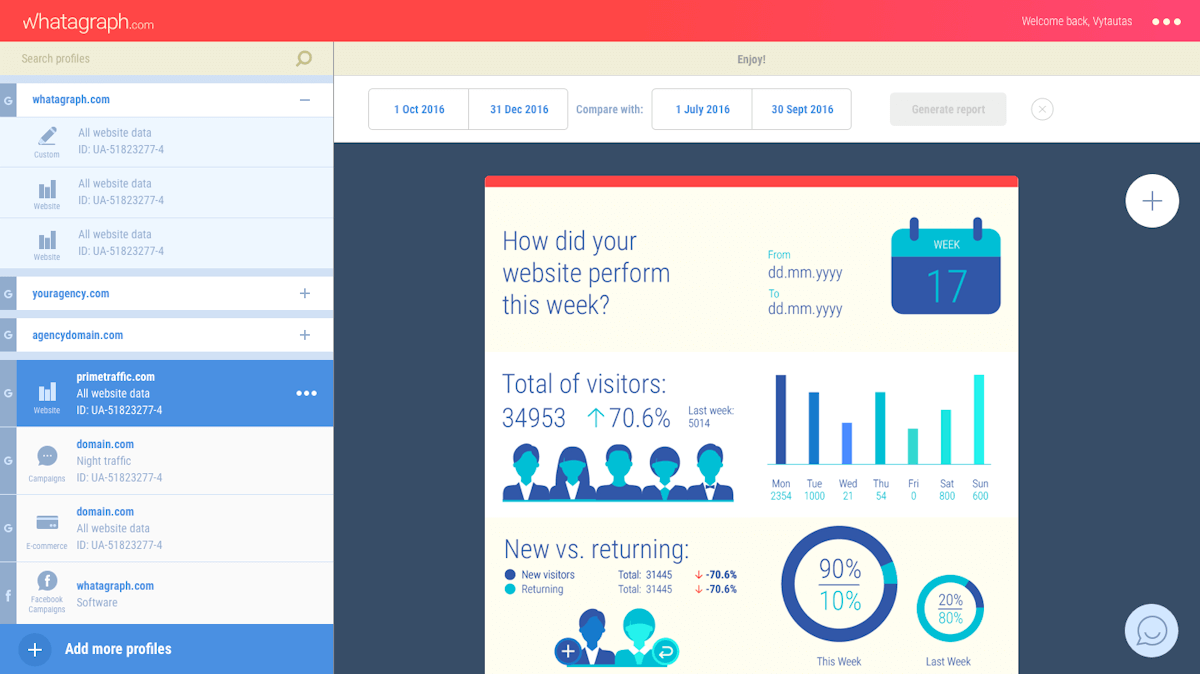
Whatagraph is a multi-account, cross-channel marketing performance reporting solution that is created, keeping in mind the digital agencies. It is designed to simplify the reporting and analytics tasks with the help of automatic data visualization functionality. With Whatagraph, you can easily transform website and social media numbers into robust, clear, and simple infographic reports.
Unlike your traditional reporting tools, Whatagraph supports multiple integrations. You can group your reports by departments or projects, assign responsible users to specific marketing campaigns, and set unique branding for specific campaigns, among many other features that will make reporting one of your favorite things to do and will definitely make your reports stand apart. While it is a paid service, you will only have to pay for what you need. There are no hidden charges or costs associated with the service.
Whatagraph is designed, keeping in mind the visual appeal. Anybody could get easily bored with numbers, and they are not easy to understand as well. Whatagraph provides modern businesses and agencies with a fresh perspective to reporting. As a marketer, you can present data and numbers in numerous ways that people can easily comprehend and process. When we talk about the visual way of presenting information, it is not just the charts, graphs, and bars, but Whatagraph focuses on an infographic-style of reporting. This type of reporting is way better than the charts and bars you see in many other reporting tools, like Google Analytics.
Whatagraph is designed intelligently, which is capable of gathering data automatically from over 10 different data sources. This includes social media networks like Facebook, Instagram, YouTube, LinkedIn, Twitter, and Google Analytics, among others. Once it collects data from the necessary sources, it allows you to create custom reports based on any preferred template you choose. In short, you will be able to place data and information in a visualized manner, exactly the way you want it. In addition, for added personalization, you can also integrate branding elements into your marketing reports.
Once you decide what information to keep and what to discard, Whatagraph will automatically generate the report and send it to your recipients for hassle-free distribution.
How can Whatagraph Help you with your Reporting Issues?
Creating reports is a lot more daunting than it seems. There are numerous entities involved in the creation of a report, and yes, it can give you cerebral pain. Every marketer’s worst nightmare is what if they miss to include any information. They will have to do it all over again because the report format is set, and tweaking it accordingly can make your groan. This is where a handy reporting solution can make things easy for you. Whatagraph is designed for modern businesses that use cross-channel marketing for brand promotion, or selling product/service. It takes care of the three most common issues that come with reporting.
Problem 1: Spending hours on manual reporting tasks
First and foremost, creating a marketing report is a time-consuming process. You could end up spending a lot of time creating a report and end up still not being satisfied with it. As a marketer, you will be asked to create a performance report by the client every month that shows the results of the implemented strategies. It can be anything from showing how the website traffic changed in the last 30 days to how much traffic the website received in the given period, and more.
These are tasks that require you to generate lots and lots of numbers because you cannot just rely on one number. So, generating numbers, taking screenshots, filling the datasheets, and looking into Google Analytics to see if you missed anything, all these make it even more daunting because now you are confused about how you are going to intelligently place these numbers in an understandable way. So, overall, the task requires you to create graphs to make the report look less dull and fill it with context, charts, screenshots, your comments, and the action plan to form it into a complete report.
This is a fairly simple report that can take anywhere between 50-60 minutes. Now suppose, you have to create six such reports. It is a waste of your valuable time. Whatagraph allows you to create and automate visual marketing reports within minutes. Whether it is email, SEO, PPC, social media, or any other marketing channel, it allows you to get all the analytics in one place, simplifying your reporting and marketing campaign assessment.
Problem 2: Non-technical people have difficulties in understanding analytics data
Another major concern that many marketers have when creating a marketing report is that they are unsure whether non-technical people in their teams or clients will understand the numbers. In your team, you will have people with different technical backgrounds or no technical background. So, it can be really challenging to keep them interested while you are presenting the report. It will be really awkward to see your colleagues or client yawing and fiddling while you go through the numbers.
The purpose of reporting is not just to put all the numbers in one single place and present them to your colleagues or the client. The goal is to make sure that recipients understand what the numbers relate to, what are the significance of these numbers, how it can help them achieve marketing success and more.
With Whatagraph, you can create reports with infographic data presentation. This means that the recipients can visualize the channel growth and performance much better. As a result, they are sure to ask you questions, interact with you during the presentation, and brainstorm ideas for better marketing strategies.
Whatagraph is designed to trigger engagement between the team members. When people start understanding technical stuff, it becomes easier for them to comprehend the situation and what you are trying to project.
And using the Whatagraph dashboard, you can share the reports with your team members and colleagues to let them take a closer look at the figures they need to work on.
Problem 3: The need for branded data reports on the go
When you create a marketing report, you would want it to be branded with your company logo so that it is presentable. It is extremely important when you are pitching to new clients because a report with the company logo shows that it is authentic, and nobody has rights on your report.
With Whatagraph, the report is already saved in the dashboard. So, you don’t have to carry the hard copy all the time with you, especially when you are traveling. In conferences, seminars, and meetings, you can access these reports on the go with Whatagraph.
The best part is that Whatagraph offers customization options where you can upload your company’s brand logo to the report before printing it out. This is a huge time-saver as you can access the report anytime from anywhere.
Whatagraph Features
There are a lot of things that Whatagraph can do, but these features are what that may induce you to buy the service.
#1 Review and check reports before sending them
Cross-checking is always advised whether you are creating reports or any other sensitive document. You would want to double-check that the numbers are in place, and there are no errors. And to do this, you don’t have to go through the report all over again. Simply scan the report and click approve. If there is any mistake, you will know.
This is a handy feature that you can use, especially when you create an automated report. You can also use it when you are editing an existing report. Even if the report is created and finished, it won’t go out until you have approved it.
#2 Automation
This is the most amazing feature of Whatagraph. It saves tons of time and creates accurate reports. You don’t have to anymore spend hours manually creating the reports. At first, creating a report may seem fun and all, but it becomes boring when you do it over and over again. While it is boring, reporting is an inevitable part of marketing.
Automation comes in handy if you have to run special reports for clients every week. Whatagraph will automatically create reports based on your requirements. That is, you can choose how often you want the reports to be sent, and on which day. The best part is that Whatagraph will send you a reminder before the report is sent. So, in case if you don’t want to send the report, you can abort it before the designated schedule.
#3 Customized formatting
While there is no issue with creating a plain-old report with simple B/W formatting, having a customized report gives a solid impression of how dedicated you are. Presentation is always the key to lure the recipients.
With Whatagraph, you can personalize your reports based on your requirements. Customizations you can perform with Whatagraph include:
- Specify the company name
- Upload company logo
- Specify the domain name
- Select a color scheme
- Assign an account executive (who is responsible for the report)
- Customize the reply-to address for the marketing report
#4 Add comments to your report
There are instances when the recipient may not understand certain parts of the report. Then it becomes difficult for you to explain to them what it is. Whatagraph provides a feature where recipients can add comments to those parts that they don’t understand.
Then you can reply to those comments explaining to them what they are looking at. This is a great feature, especially for the clients, because they can’t visit you every time at your office. You can simply send them a copy of the report. They can open it, read it, and comment if there are parts that they don’t understand.
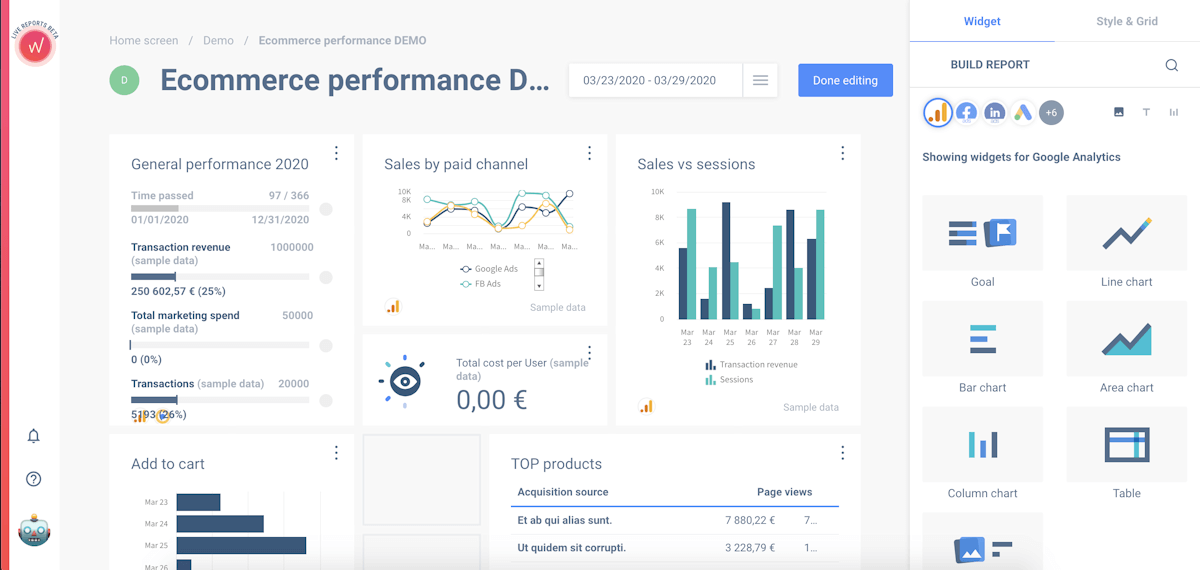
#5 Custom data widgets
The data widgets feature of Whatagraph lets you add a static piece of information to your marketing report. Custom data widgets include a report title, text lists with one to five values, static comments, a line of graph values, a histogram of values, data values, and comments. You can use these widgets anywhere in the report.
#6 Multi-source reports
As a digital marketer, you probably are operating on different platforms at once. This means that you may have multiple sets of reports to manage. It can be daunting to do it over and over again.
Whatagraph allows you to embed all your marketing channels with a few mouse clicks. Then you can integrate the analytics widgets to your reports. This converts multiple reports into a single report. It is an incredibly beneficial feature that saves time and effort.
There are different ways to create multi-source reports. For starters, you can compare the marketing campaigns across different marketing channels or create a report to determine how the landing pages are performing. Whatagraph also provides e-commerce report templates. You can use it to compare the best-selling products and get an overview of the revenue they generate.
#7 Quick handovers to team members
Whether you are taking a few days off or going on a business trip where you cannot manage marketing reporting, you can hand over the reporting responsibilities to one of your team members.
You can create multiple ‘Responsible Users’ on Whatagraph. And whenever you are not able to take the lead, you can assign another responsible user to perform the activities to ensure that there are no interruptions to client communications in your absence.
The clients or the recipients will continue to get their marketing reports on time whether or not you are there.
#8 Personalized reports
Depending on the technical knowledge of each recipient, you can personalize the report and send each one of the recipients with personalized reports. For example, you can send the technical team of your client a fully optimized report that contains all the necessary numbers, graphs, and bars. On the other hand, you can send a little less technical report containing the same information to the higher authorities who don’t have a very good technical background. That is, in a full technical report, you can mention what numbers the campaign is generating, how many likes, comments, and shares the post received, and things like that. And the content you send to the non-technical recipients contains the exact same numbers but with more context so that they don’t feel overwhelmed.
#9 Well-organized client management
Whatagraph allows you to create dashboards based on different client areas. You can have distinct report settings, inputs and formatting, and a team manager for each client. This makes client management a hassle-free task.
#10 Hassle-free sharing capabilities
Last but not least, Whatagraph allows you to share reports any time and from anywhere. Sharing reports have never been this easy. You can save a direct link to the report, integrate reports into other documents, and create instant reports and share it with your colleagues.
Whatagraph – device supported
- Web-based
- Linux
- Mac
- Windows
- Mac
- iPad or iPhone
- Android
Whatagraph – support
- Live Support
Pros & Cons
Pros
- Saves a lot of time and effort spent in creating a marketing report
- Great formatting options for a personalized feel
- Easy to use
- Customizable dashboard
- Financial reporting included
- Scheduled and automated reports
- Exceptional customer support
Cons
- Current data sources are limited
- Price might be too high for some freelancers or smaller marketing agencies
Final Words
There are plenty of reporting tools available on the market, but you will not find anything like Whatagraph. It is a great option for businesses of all sizes – small, medium, large. Its unique features will allow you to create instant reports and share them with your colleagues.
About the Author

Wendy Gooseberry aka “The Goose” aka “Very-Berry” is content creator and writer. She loves all-things marketing, technology, and bird watching.


